What is Currency Strength?
Currency strength meter is a unique and increasingly popular indicator used by Forex traders to make better trade decisions and find more trade opportunities.
Traditionally traders rely on fundamental analysis, technical analysis, or a combination of both.
Fundamental analysis focuses on macroeconomic and other geopolitical events that can affect a particular currency.
For example, the movement of the US dollar following the release of US non-farm payroll data, a surprise FOMC interest rate announcement, or an unexpected Moody’s Ratings downgrade.

By contrast, technical analysis focuses on charts and indicators – trendlines, support/resistance levels, Fibonacci, pivots points, RSI, stochastics, moving averages etc. These technical methods focus on one particular Forex currency pair at a time.
What makes a Currency Strength Indicator different?
Currency strength indicator provides a different market perspective by measuring the strength or weakness of individual currencies rather than currency pairs.
This technique is effective because Forex pairs are intrinsically correlated by the currencies each pair shares e.g. USD in EUR/USD and GBP/USD.
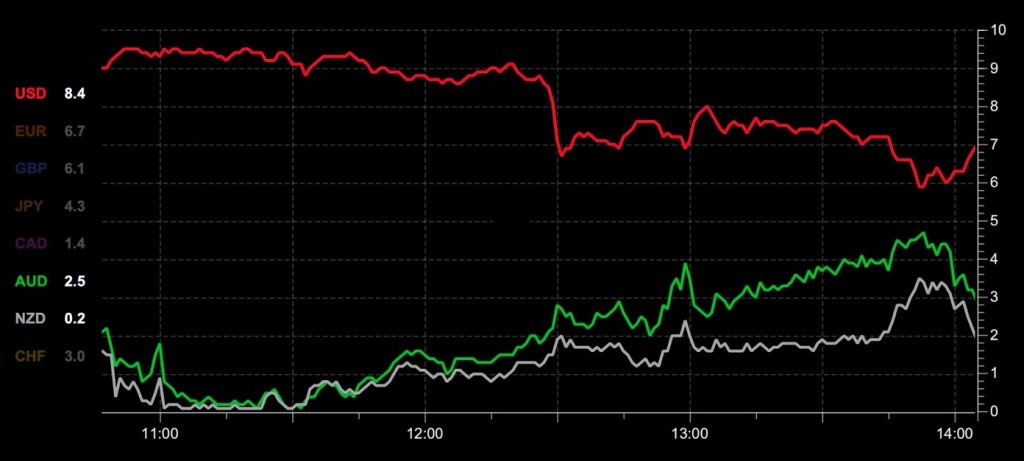
Furthermore, some currencies are correlated themselves e.g. AUD, NZD, and to a lesser extent CAD, tend to move together.

The chart above shows the typical close correlation between the AUD and NZD currencies. Any divergence is usually short lived, and may signal a good trading opportunity on the AUD/NZD pair. This is just one of many ways to use a currency strength meter to find trades.
How is Currency Strength Meter data calculated?
Currency strength is calculated using real-time and historic price data to measure the price movements of a large group for Forex pairs. Data from 30+ Forex Pairs is used to calculate currency strength values for the 8 major world currencies:
- USD: US Dollar
- EUR: Euro Dollar
- GBP: British Pound
- JPY: Japanese Yen
- CHF: Swiss Franc
- CAD: Canadian Dollar
- AUD: Australian Dollar
- NZD: New Zealand Dollar
Strength is reported on a scale of 0 (weakest) to 10 (strongest). Currencies with strength values below 2 are considered very weak, and those above 8 very strong. Currencies not trending fall into the mid range of 4 to 6.
The table below shows the currency strength indicator data for multiple timeframes with the weakest and strongest currencies highlighted. With just a quick glance you can instantly see what currencies are in play.

Is Currency Correlation the same as Currency Strength?
They’re different concepts. Currency correlation measures how closely two Forex currency pairs move together.
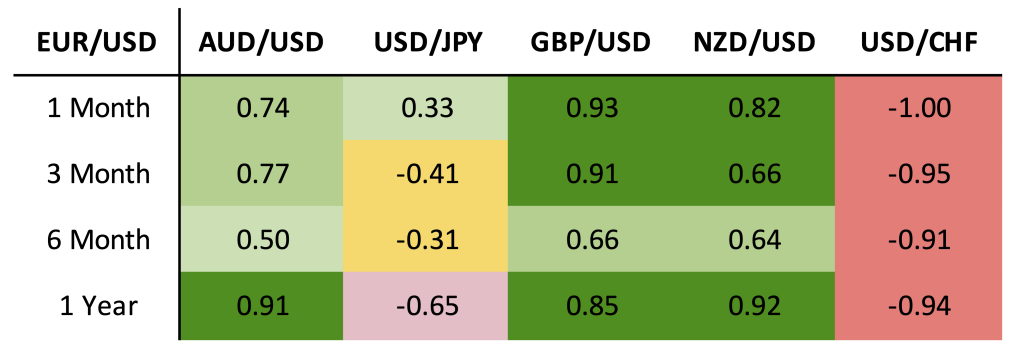
Currency correlation is measured on a scale from -1 to +1. A correlation of +1 indicates that two currency pairs move together closely in the same direction, while a value of -1 means that they move in opposite directions. A correlation close to 0 suggests no relationship between the two currency pairs. Calculating currency correlation involves statistical analysis, typically computed using the Pearson correlation coefficient formula.
Currency correlation is extremely useful when managing the risk of a Forex portfolio position. Correlation data can identify tightly correlated trades that add to the overall risk. It can also be used to identify negatively correlated Forex pairs that can be used as a hedge to reduce risk of the overall portfolio position.
Correlation data is calculated for specific Forex pairs for several time intervals, and is usually presented in a table for easy interpretation.

Key Takeaways
- Currency Strength reports data for individual currencies (e.g. USD) rather than Forex pairs (e.g. GBP/USD)
- Conventional technical indicators (e.g. RSI, moving averages) use data from only one Forex pair at a time (e.g. GBP/USD)
- Currency Strength uses real-time and historical data from 30+ Forex pairs giving a more complete market overview
- Currency Strength is effective because Forex pairs are intrinsically correlated to varying degrees
- Some currencies (e.g. AUD and NZD) are tightly correlated. A temporary divergence can provide a trade opportunity
- Currency Strength is reported on a scale of 0 (weak) to 10 (strong).
- "Currency Correlation" measures how tightly coupled two Forex Pairs are. This is important for portfolio risk management.

